Victoria’s building industry remains strong
All sectors experienced heightened activity levels compared to a year ago, except for the domestic housing market, with residential (46 per cent), hospital/healthcare (27 per cent) and public buildings (25 per cent) showing the strongest year-on-year growth (Figure 1).
Projects in the residential, hospital/healthcare and public buildings categories recommenced following delays resulting from the global impacts of the COVID-19 pandemic, explaining the strong growth from the previous year.
This reflects the high public investment and pipeline of major projects underway across Victoria and confidence in the residential market.
The largest increase in approvals was in inner Melbourne, where a 12 per cent spike in the number of building permit approvals was observed, fuelled by the end of COVID-19 lockdowns and revived activities across the commercial sector, namely office and retail.
In regional Victoria, 42,045 building permits were approved, with the South West region leading the way with 11,961 permits. Overall, regional building permit activities contracted nine per cent compared to a year ago, after experiencing strong growth with more people interested in relocating to regional Victoria during the pandemic. The decrease in regional permits was across all areas.
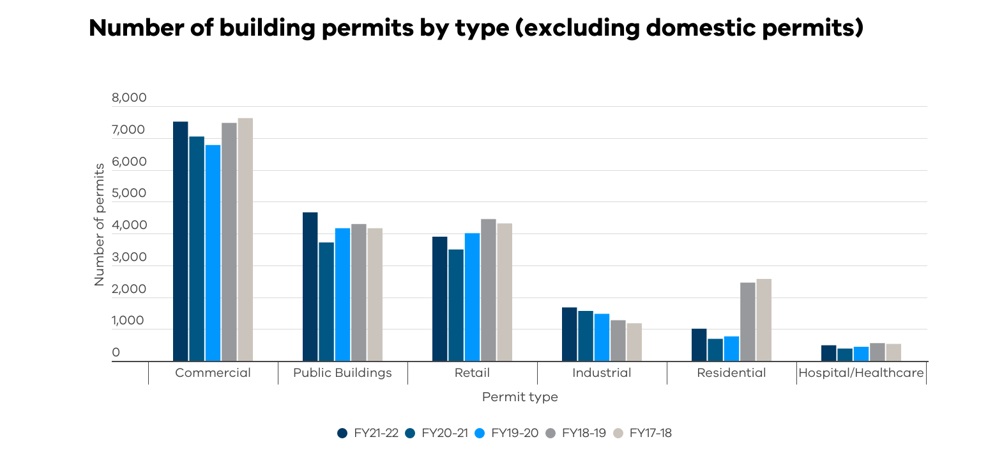
Figure 1: Number of building permits by type (excluding domestic permits) by financial year.
More than 100,000 domestic building permits were issued in 2021/22, but five per cent fewer than the record 106,425 permits issued in 2020/21.
Government stimulus in the domestic housing market, such as the Home Builder initiative and First Home Owner Grant caused a spike in demand for domestic housing in 2020/21.
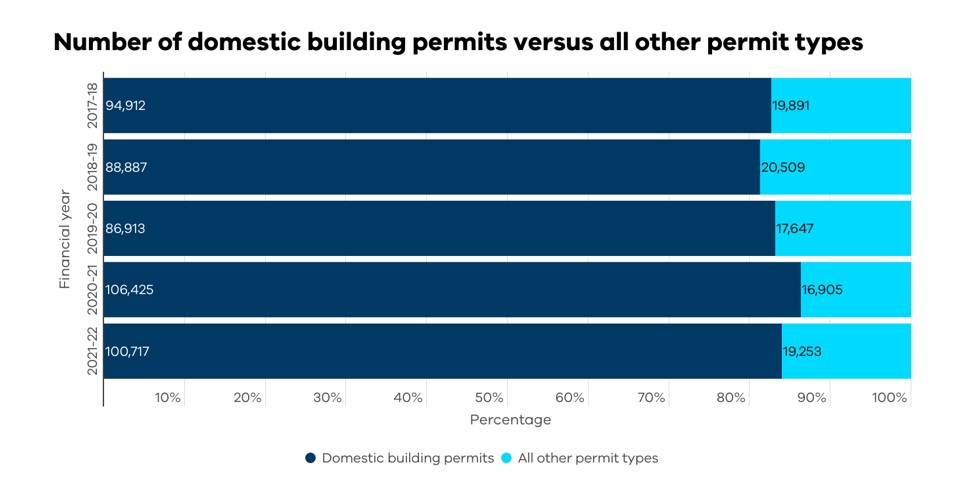
Figure 2: Number of domestic building permits versus all other permit types.
Following the conclusion of the Home Builder program, domestic building activity reduced but remained higher than pre-pandemic levels.
Year-on-year, the number of building permits for new builds declined nine per cent, however there were significant increases in re-erection permits (25 per cent) and demolition permits (19 per cent).
This may reflect consumers choosing to stay in their current properties and renovate by leveraging the HomeBuilder grant, instead of investing larger sums of money in a new building.
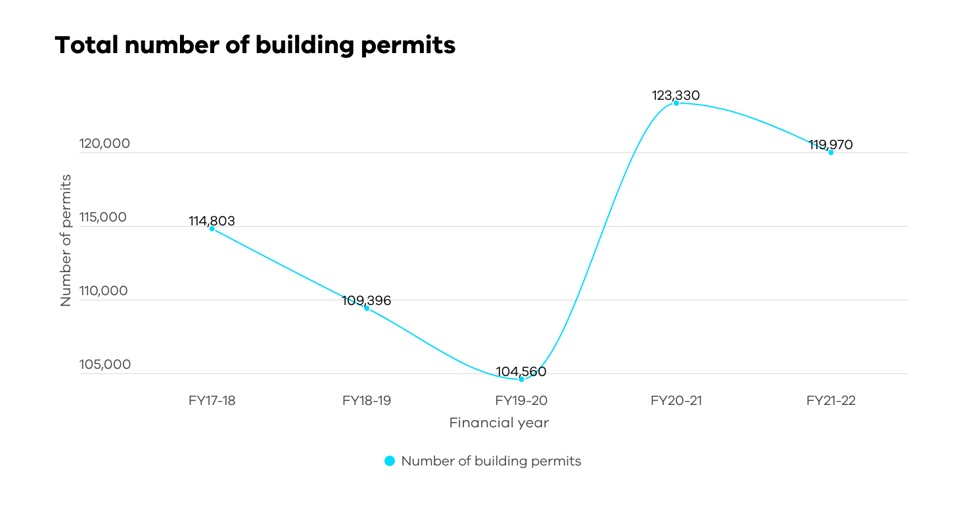
Since the 2017-18 financial year, the total number of building permits issued has increased 4.5 per cent. Compared to FY19-20, the first full year of the pandemic, FY21-22 has seen a 14.5 per cent increase (Figure 3).